The Sun’s reach, visualized in real data
OpenSpace visualizes live and historical space weather data so you can see exactly what the Sun is doing to our solar system, from solar wind all the way to coronal mass ejections.
Built with NASA CCMC scientists
OpenSpace’s heliophysics tools were built in close collaboration with scientists at NASA’s Community Coordinated Modeling Center (CCMC), the group behind the operational space weather models that forecasters rely on every day. What you’re seeing isn’t an approximation of solar activity. It’s the actual simulation data, made explorable in 3D.
Real operational models
OpenSpace runs on ENLIL and BATS-R-US, the same models CCMC scientists use for real-world forecasting. Every particle field and magnetic field line comes from actual simulation data.
Historical storm archive
Step back through some of the biggest solar events on record, including Bastille Day 2000 and the 2012 near-miss CME, using the same archived model runs that researchers study today.
Heliophysics profiles
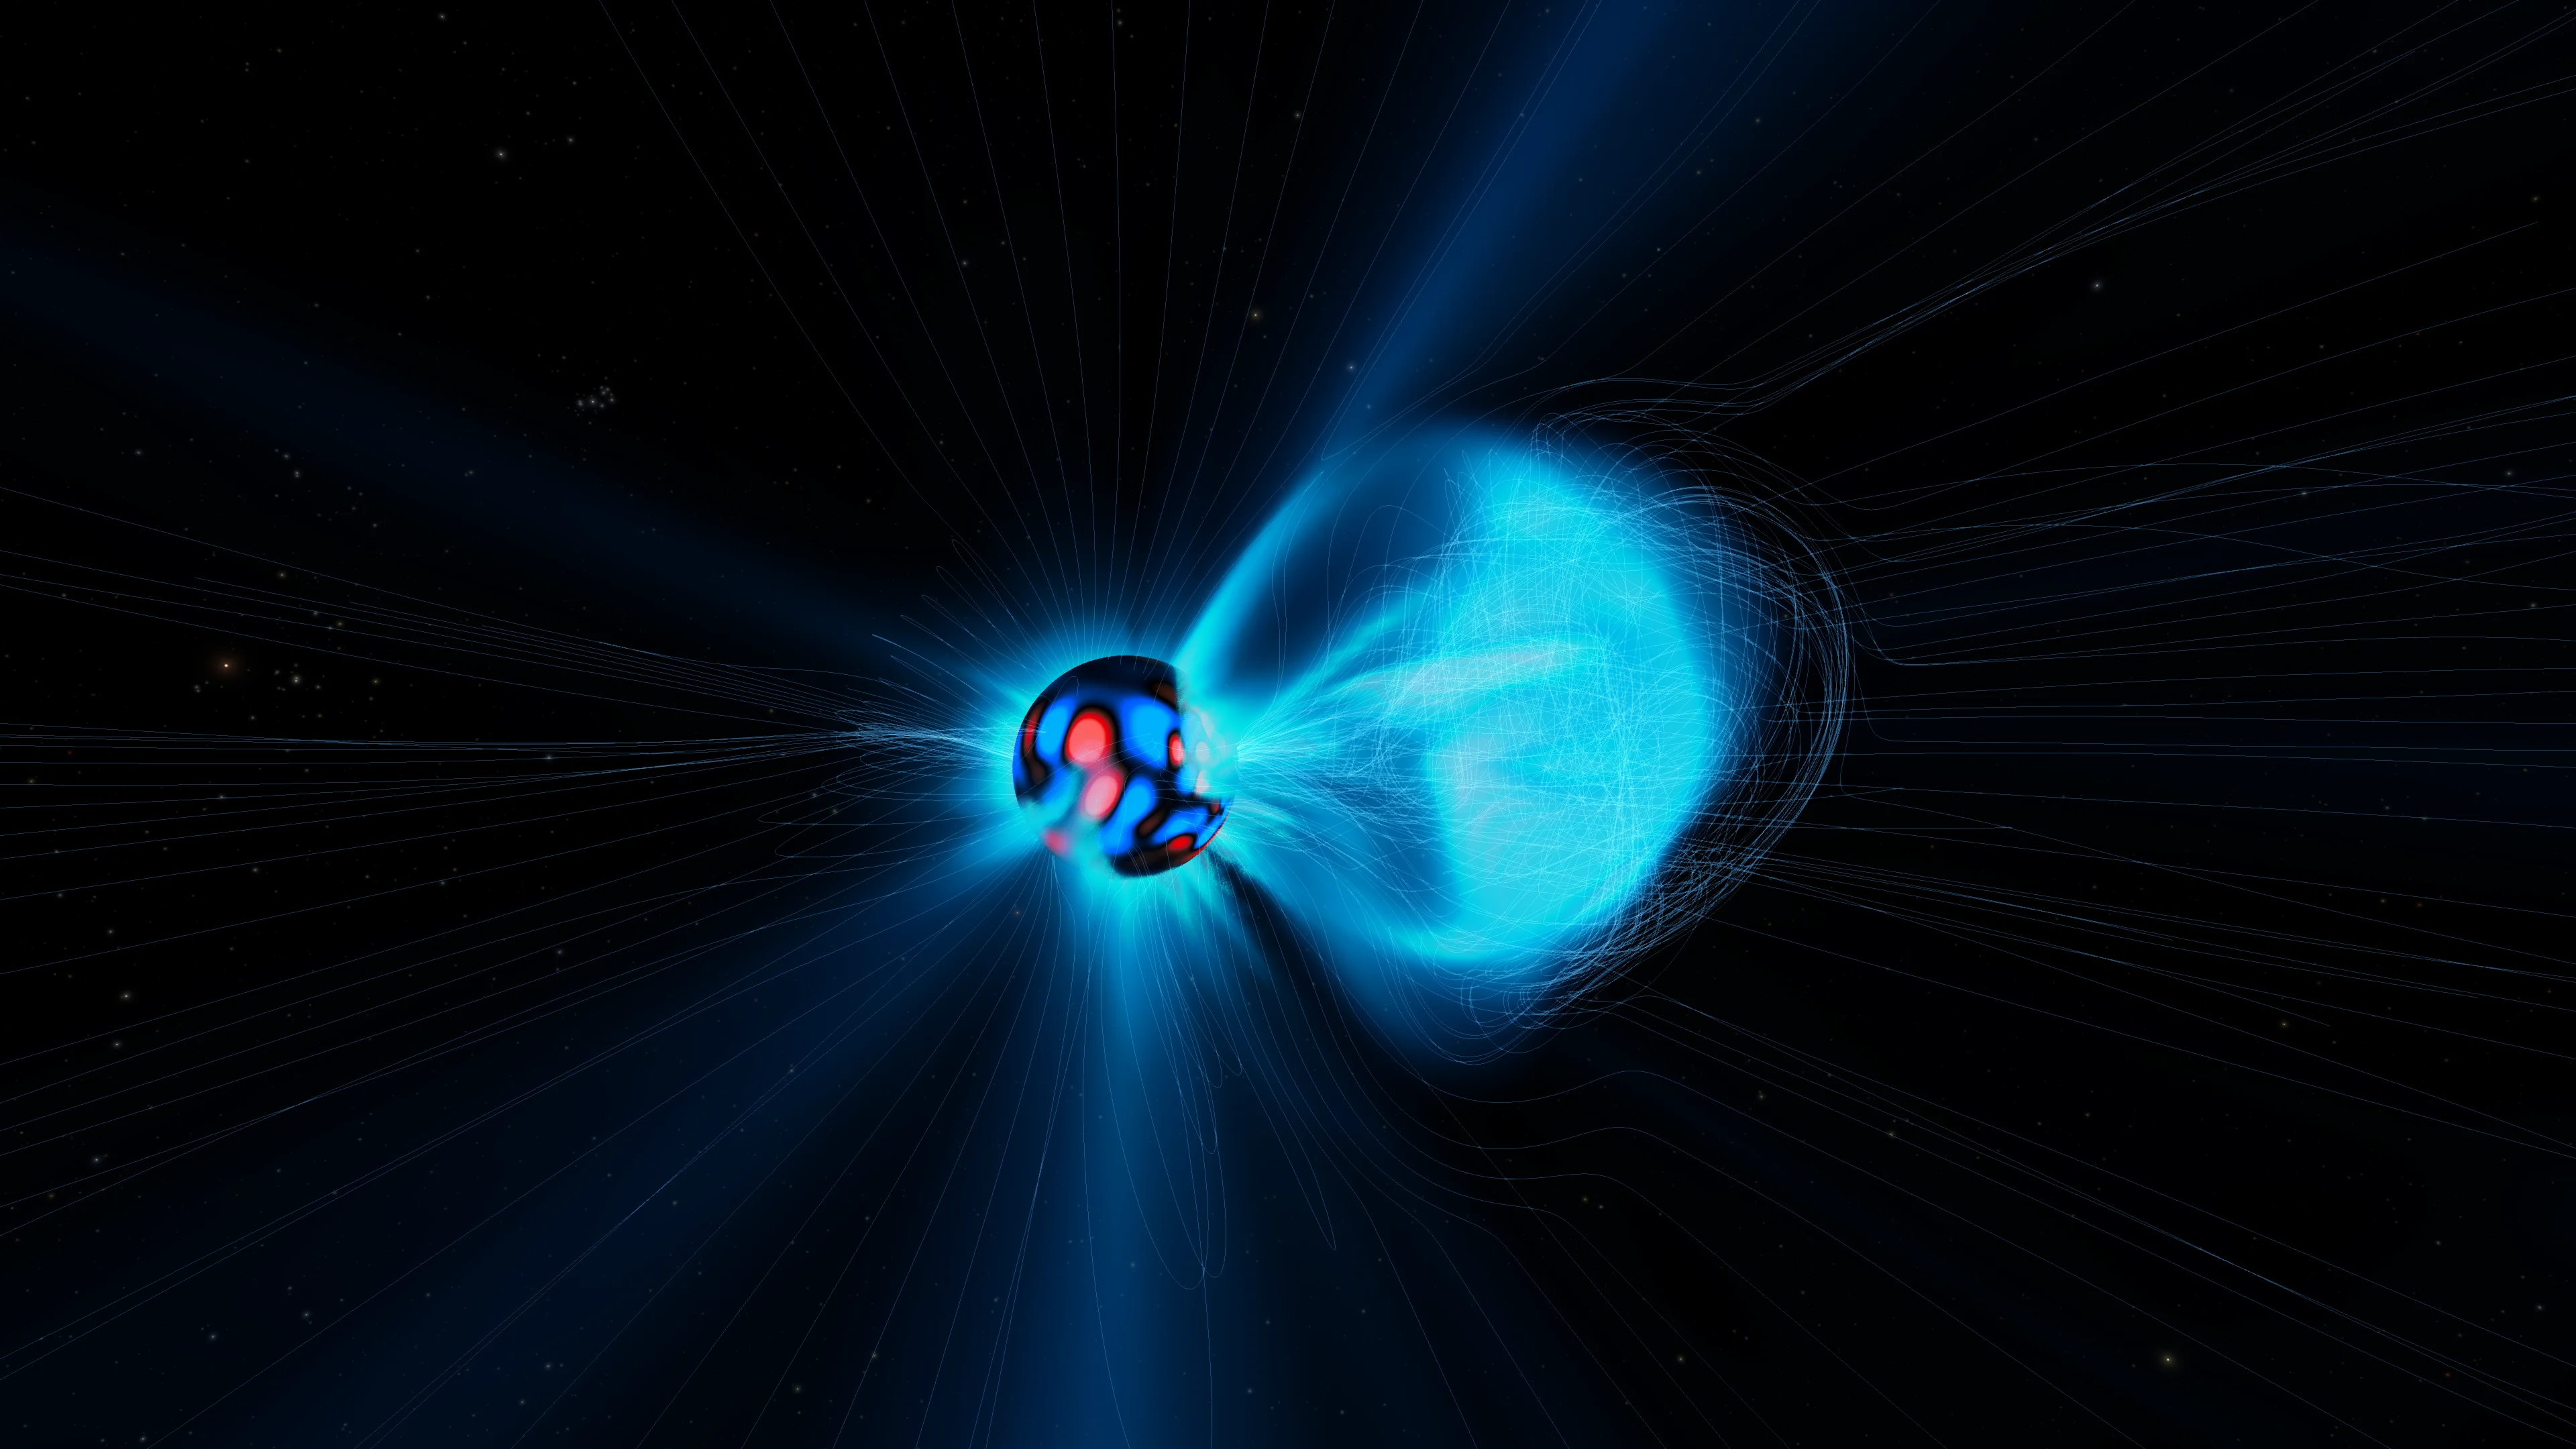
Bastille Day 2000
X5.7 solar flare · July 14, 2000
One of the most powerful solar storms of Solar Cycle 23, this X5.7 flare triggered a severe geomagnetic storm that disrupted satellites and pushed the aurora as far south as Texas and the Mediterranean. OpenSpace recreates the full event using ENLIL simulation data from NASA CCMC.
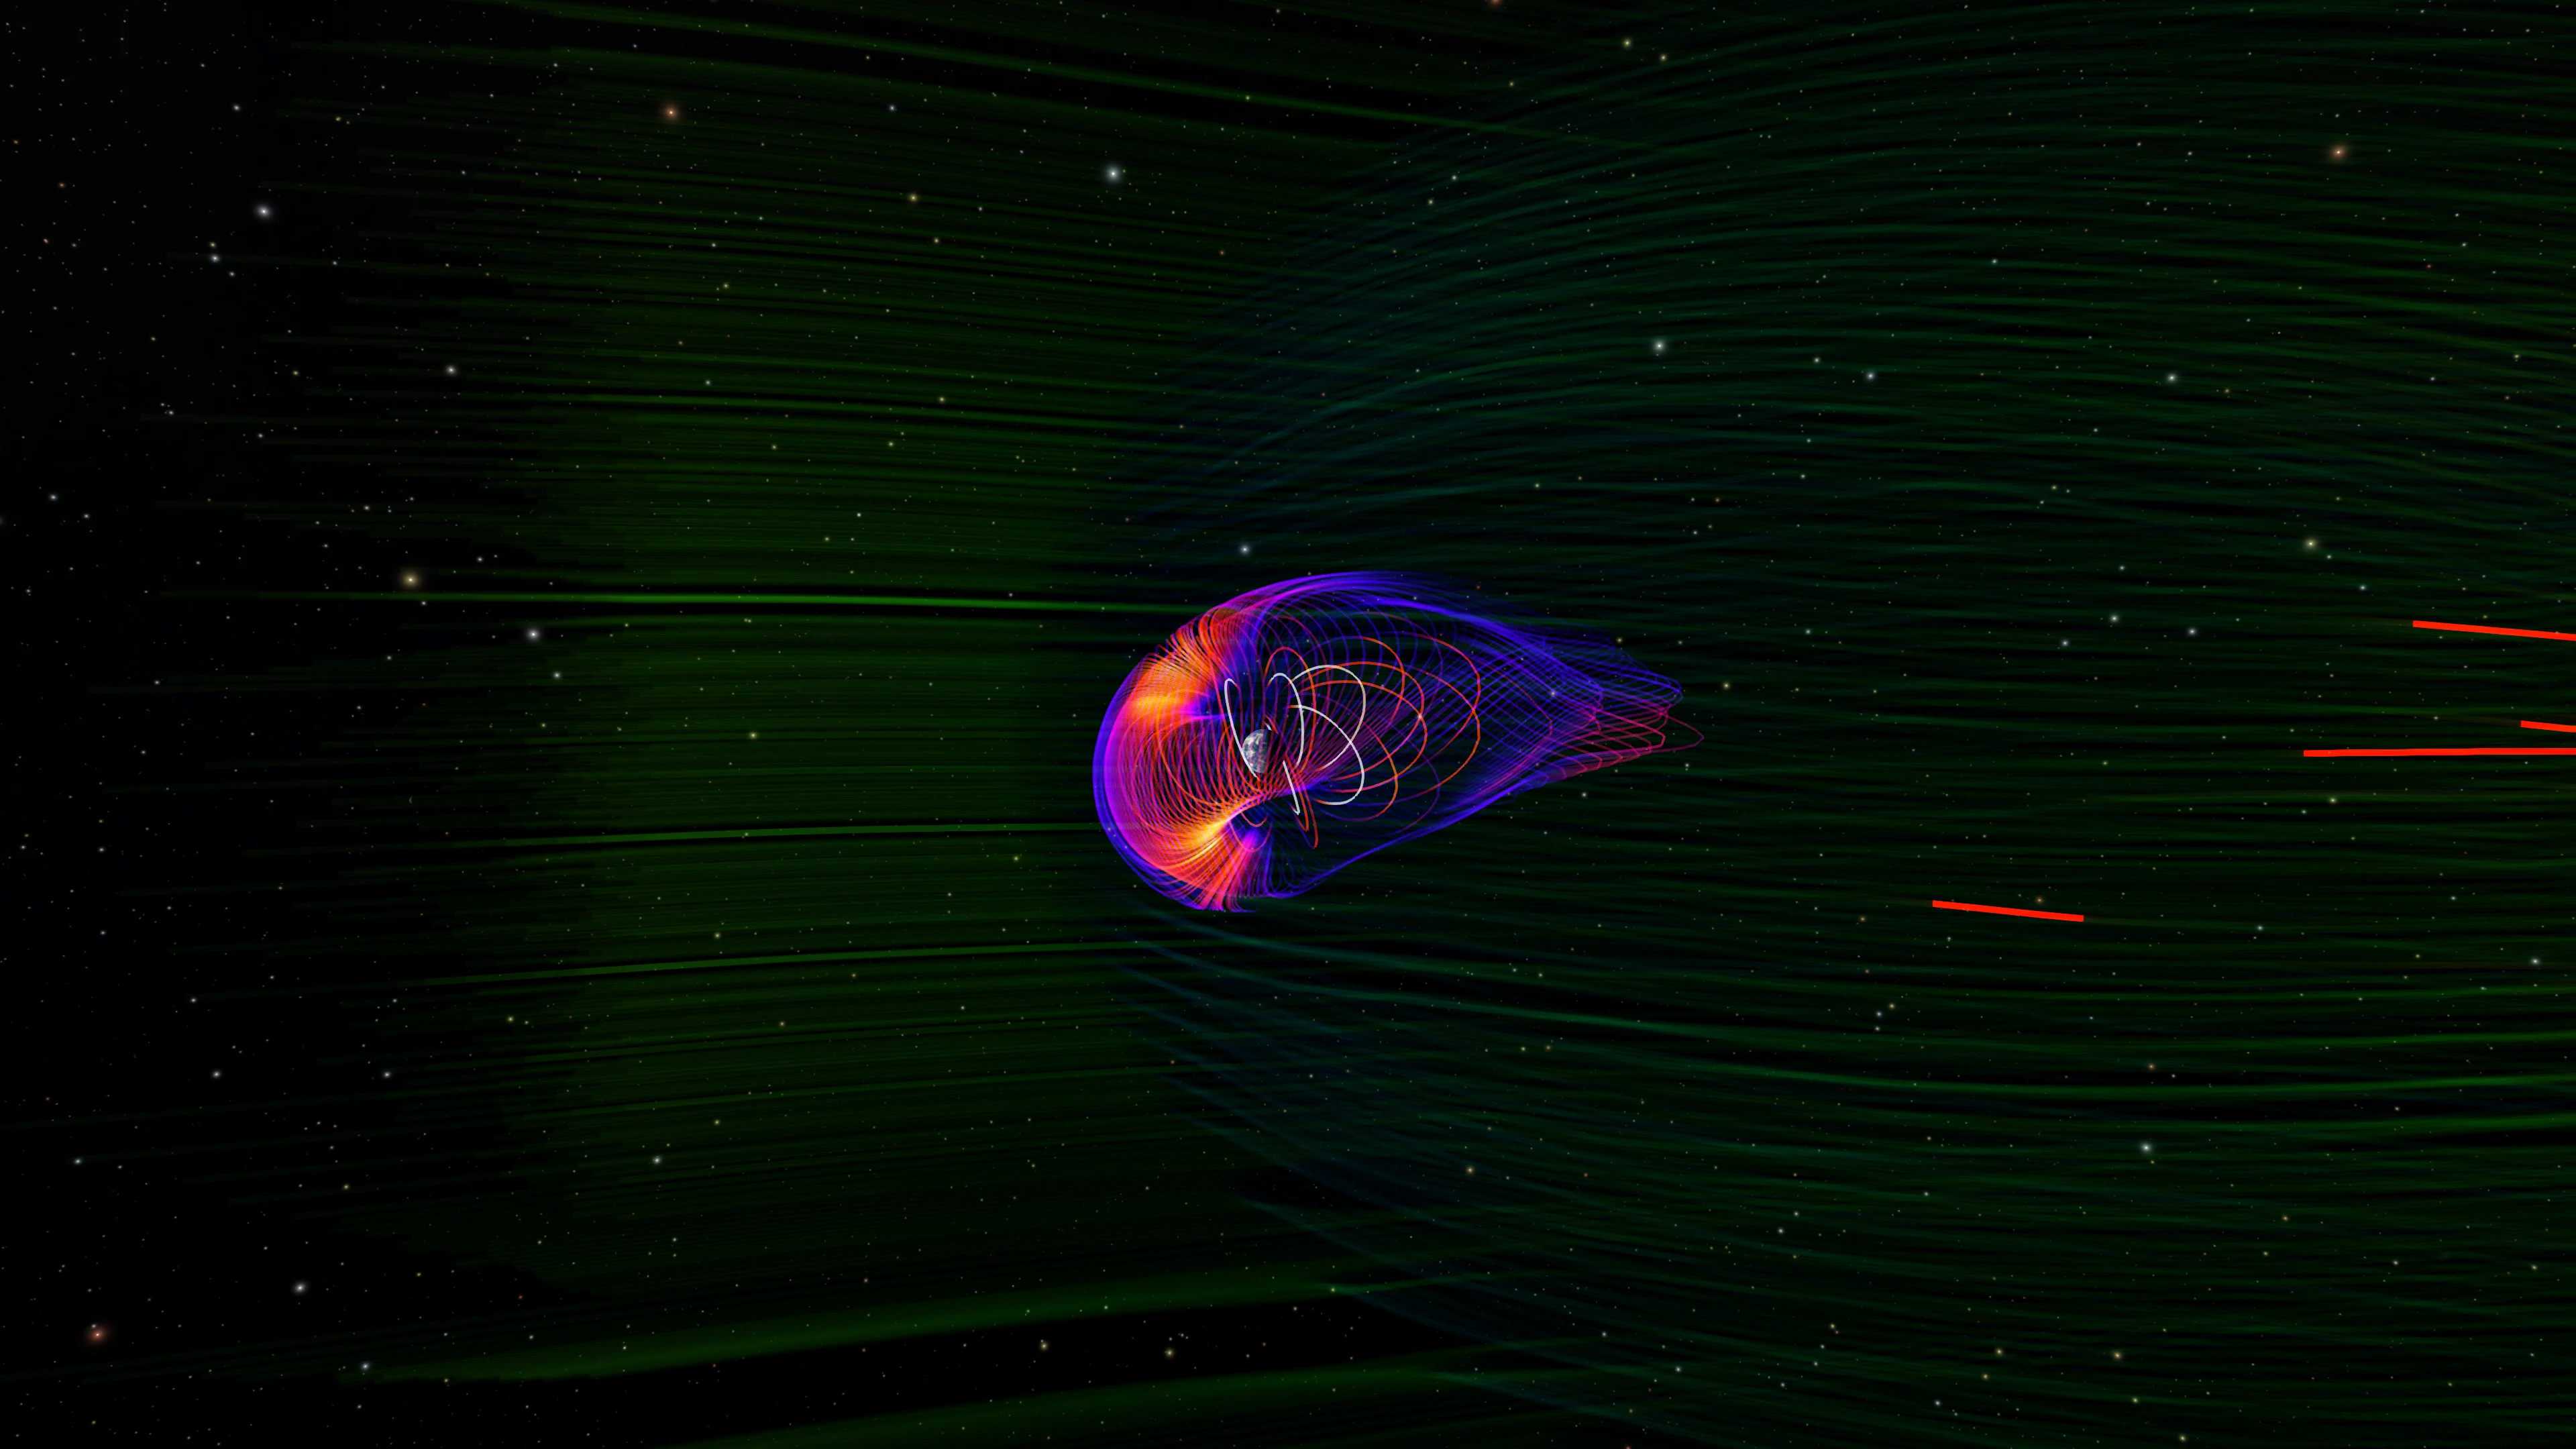
Solar Storm 2012
Near-miss Carrington event · July 23, 2012
This double CME eruption hit speeds around 2,500 km/s, making it one of the fastest on record, and narrowly missed Earth by about a week. Scientists estimate a direct hit could have caused a Carrington-level geomagnetic storm. OpenSpace visualizes the full propagation using ENLIL data from NASA CCMC.
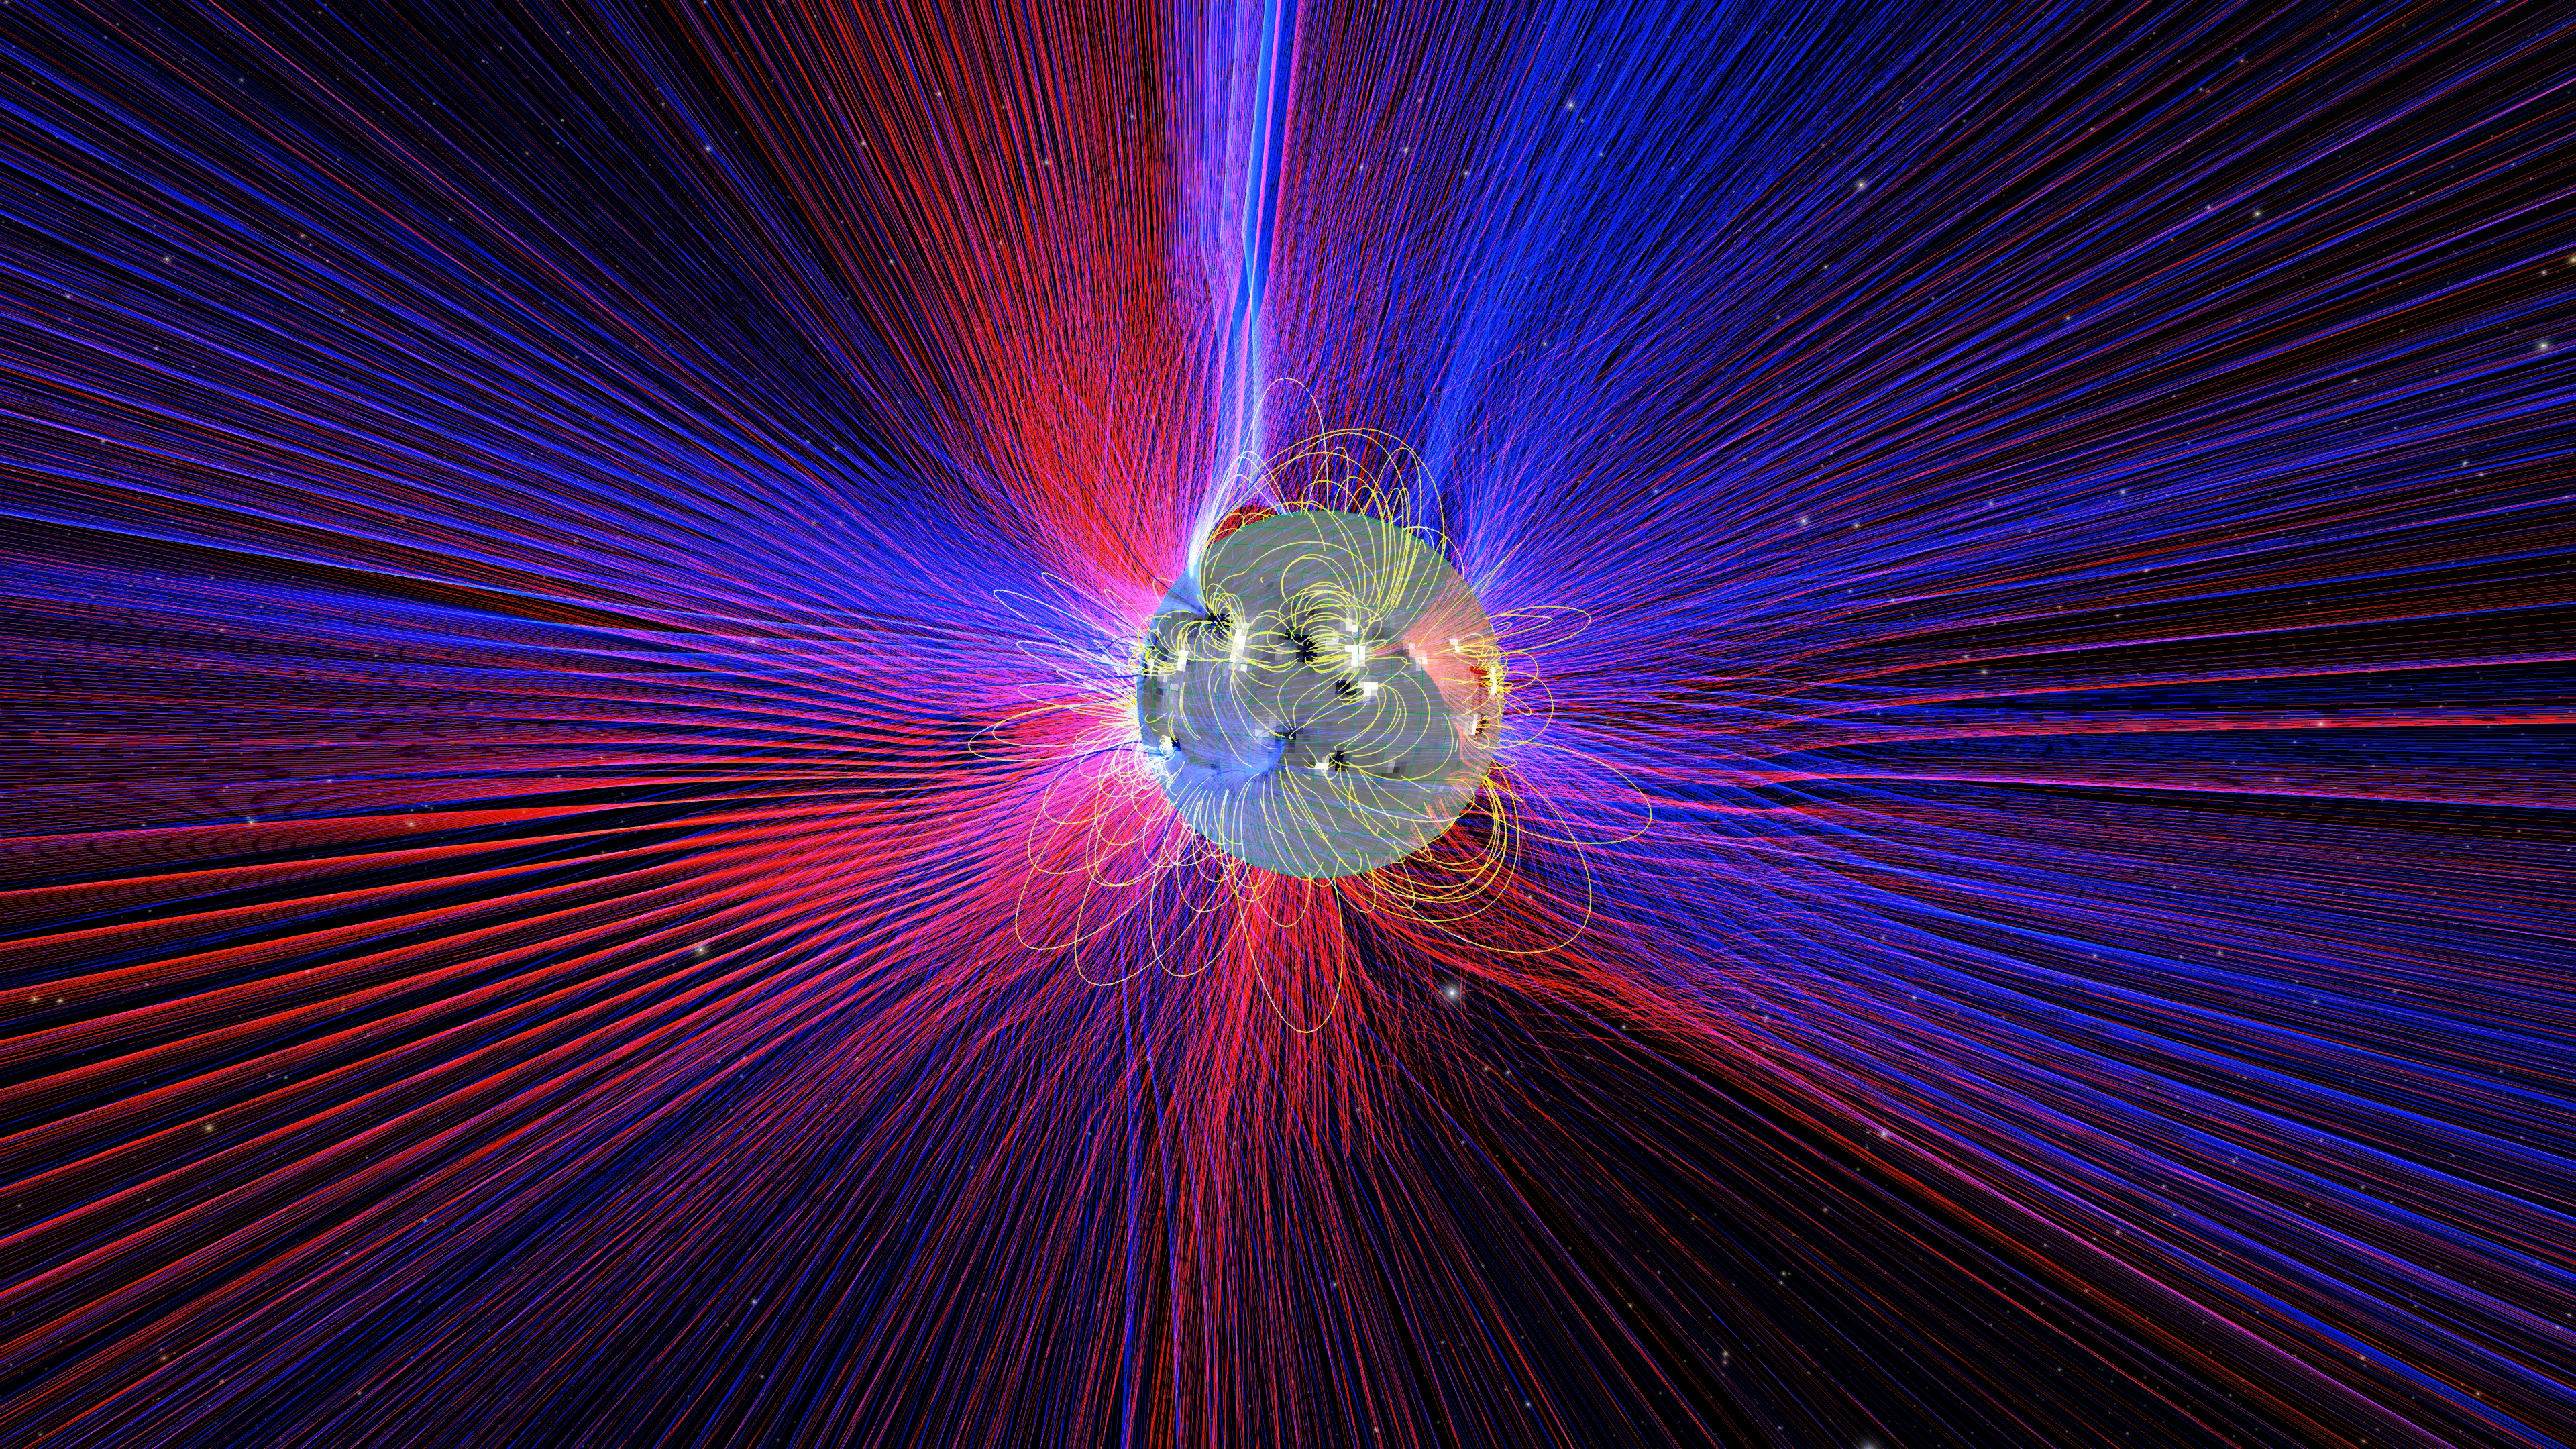
Today's Sun
Real-time solar conditions
Watch CME propagation modeled by ENLIL, see the magnetosphere respond in real time via BATS-R-US, and track the aurora oval as it updates with each new Kp measurement. All in one continuous view of the Sun-Earth system.
The Sun in multiple wavelengths
SDO sees what the eye cannot
NASA’s Solar Dynamics Observatory captures the Sun nonstop across ten wavelength channels, each one revealing a different layer of solar activity, from the cool chromosphere all the way up to 20-million-degree flare plasma. OpenSpace lets you load these image sequences and switch between wavelengths to watch the same event play out at different temperatures.
- 304 Å: chromosphere and transition region (~50,000 K)
- 171 Å: quiet corona and coronal loops (~600,000 K)
- 193 Å: corona and hot post-flare plasma (~1.2 MK)
- 211 Å: active regions in the outer corona (~2 MK)
- 131 Å: flares and erupting filaments (~10 MK)
- 94 Å: flare cores at peak intensity (~6.3 MK)
See space weather in action
Space weather visualization is built right into OpenSpace. Download it free, or head over to the CCMC to explore the underlying data models.